NEURAL ECOLOGY / OBSERVATION 001

IFFimmortal fruit flies

AI-guided perception.
Instinct follows a fixed rule.

IF—001 / ARTIFICIAL COGNITIONForaging intelligence
01 Sense02 Interpret03 Respond
NCTRMOCK CONTEXT / PATH A
01 / NEURAL OBSERVATORYNeural observation terminal
Preparing neural observationA conceptual study of perception, memory and metabolism
FLAP / BSC · PERCEPTION

Signal field

BATCH 01
SIMULATED / LOCAL PREVIEW

Two shortlisted tokens · Two simulated buys.

SignalAgePositionPreset pathway

AI screening concept · Mock signals · Simulated buys

01 / THE PERCEPTUAL APPARATUS

The anatomy
of a decision.

FROM ENVIRONMENT TO ACTION

A new meme enters the field.
AI turns observation into a shortlist.
A fixed instinct takes it from there.

Observe the shortlist
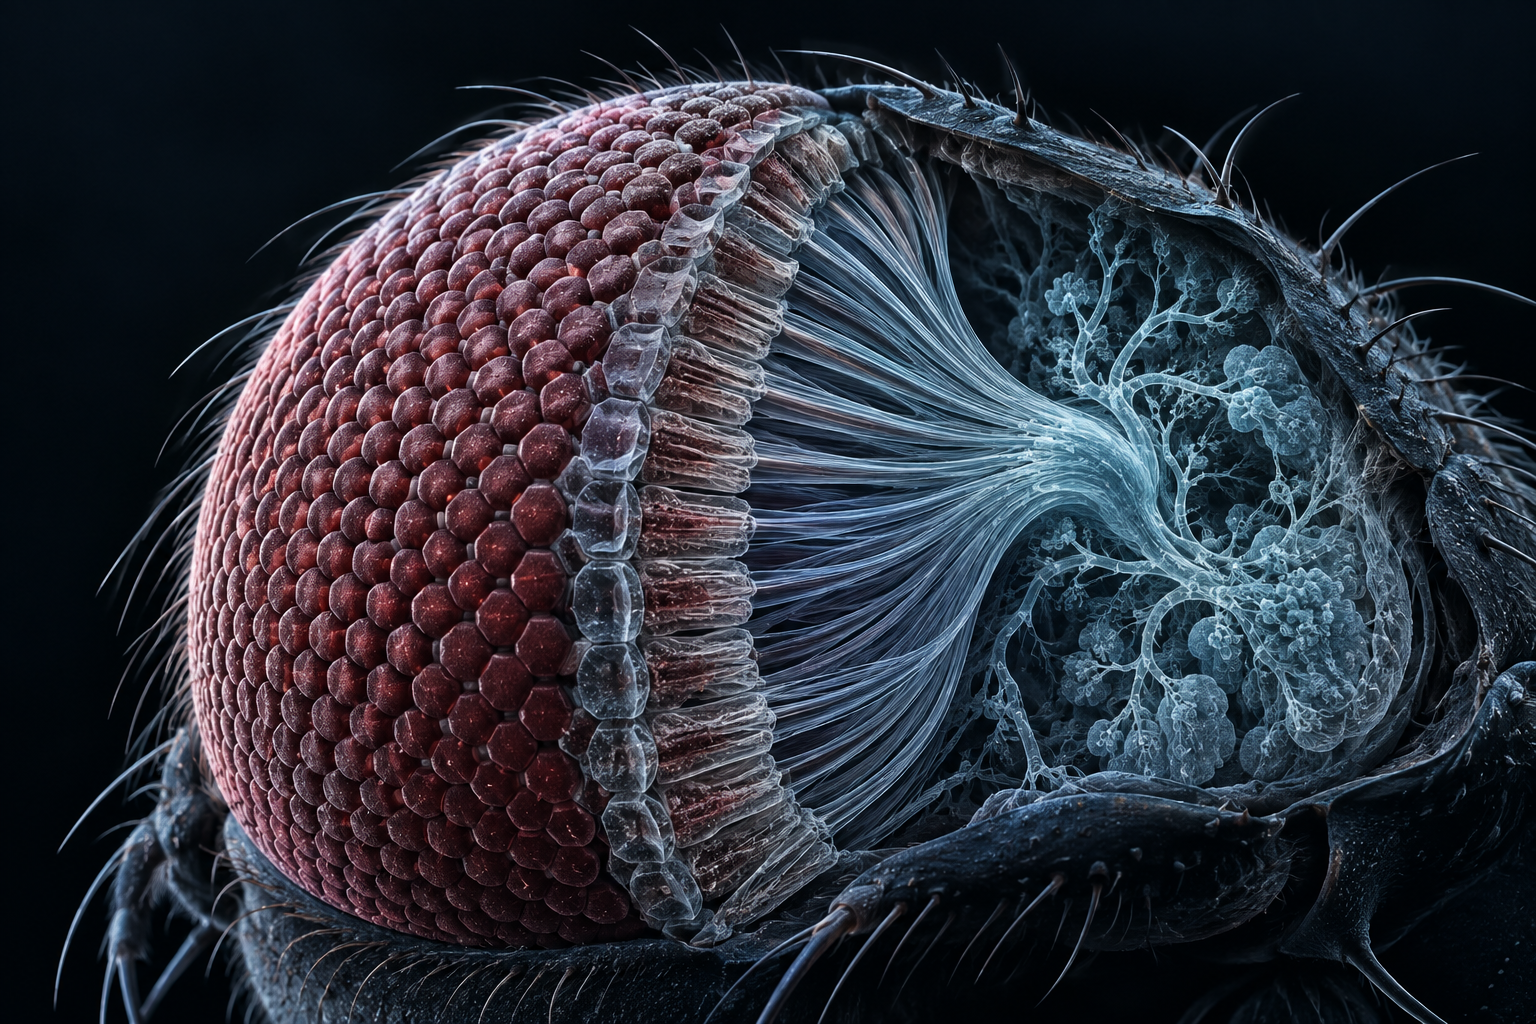
Concept artwork of a fruit fly compound eye, with rose-colored facets opening into translucent blue sensory fibers.IF—001 / SENSORY STUDYDROSOPHILA · CONCEPTUAL SECTION
PLATE 01 / THE COMPOUND EYEAI-generated concept artwork · Not microscopy

SELECT AN OBSERVATION LAYER

INPUT / AI FORAGING

The field is always changing.

Flap launches form the sensory field. The AI foraging concept brings launch activity, liquidity depth and holder concentration into one selection process. This preview illustrates the workflow with mock signals.

SENSORY ENCODING / CONCEPTNCTR / PERCEPTIONOne signal. A shared context.
PROJECT MODEL01 — 03
01 Flap signals02 AI shortlist03 Preset response04 Energy return

02 / INSIDE THE SIGNAL

A signal finds
its way.

AI PERCEPTION / ENCODED RESPONSE

Read the field. Form a thesis.
Follow a fixed response.
The fruit fly turns signals into action.

IF—001 / FORAGING INTELLIGENCE
AI / CONCEPT REPLAY
AFFERENT FIBERS
INPUT / FLAP
EFFERENT FIBERS
OUTPUT / PRESET RESPONSE
SELECTED SIGNAL / AI CONTEXTNCTR
CONTEXT CHANNELS
01Activity
02Liquidity depth
03Distribution
ILLUSTRATIVE INPUTS
INFERENCE REPLAY
  1. Encode context01
  2. Form a thesis02
  3. Route to Path A03
FIXED RESPONSE / SIMULATED
NEURAL INFERENCE COREAICONCEPT MODEL
PROCEDURAL STUDY / NOT BIOLOGICAL MEASUREMENTS
01 / SENSE

The sensory field.

New Flap launches are the input. Activity, liquidity depth and holder distribution form the proposed context for AI screening.

02 / INTERPRET

A foraging thesis.

The AI layer is designed to turn observations into a shortlist with an entry rationale. Select a meme above to read its illustrative thesis.

03 / ACT

Instinct takes over.

The sample entry follows its assigned preset. No live order is placed.

03 / METABOLISM

Two paths. One return.

Foraging gains feed back into the organism.
Two fixed return rules. Equal input.

AUTONOMIC RESPONSE LAYERAI selects the signal · Preset rules govern the return
01
FORAGING REUPTAKE

Profit feeds the return.

50% of input funds AI-guided foraging.

FORAGING OUTCOMEFIXED REFLEX77 / RETURN
TRIGGERNet profit reaches 77

Each accumulated 77 triggers one buyback.

FIXED BUYBACK77per event
02
MARKET-CAP REBUY

Return by market-cap regime.

The other 50% funds this pathway.

MARKET-CAP INPUTLOW / TIER REBUY77U / 50%
TRIGGERBelow 100,000

Below $100,000: buy 77U every 60 seconds. At $200k, $400k, $800k, $1.6m and each doubling tier: buy 50% of the market-cap pool.

LOW / TIER BUYBACK77U / 50%60s below / per doubling tier

Fixed rules · Live execution is not connected. Activity below uses mock records.

04 / EFFERENT RECORDS

Operation log

SIMULATED / SCENARIO 01

A record of each return — its trigger, fixed amount and execution state.

sample records total reuptake77 per event
RESPONSE TRACE / MOCK RECORDSSELECT A TRACE TO INSPECT
Select a recorded return to inspect its trigger.
Mock operation records. Sample time, operation, amount, execution details, mode, status and local reference.
Sample timeOperationAmountExecution detailsModeStatusReference
Loading sample records…

Mock records · Sample times and local references only. Live execution is not connected.

05 / RESEARCH ATLAS

The science behind the signals.

How structure carries a signal.
How experience shapes the next response.

FIELD NOTES / ISSUE 01 16 SEP 2026

A map is the beginning.
A response is the question.

Three research plates trace a path from reconstructed anatomy to computational predictions. Read the evidence behind the visual language.

Read the research brief Independent literature review · 3 figures · Print edition available
  1. 01 / RECONSTRUCT

    Map the wiring.

    Electron microscopy → segmentation → proofreading → connectome.

    Read the structural plate ↗
  2. 02 / SIMULATE

    Test a response.

    Connectome → neural model → stimulus → predicted activity.

    Read the model plate ↗
  3. 03 / EXTEND

    Follow the whole circuit.

    Brain + nerve cord → cell annotations → cross-dataset comparison.

    Read the CNS plate ↗
REFERENCE PLATES / 01—03ANATOMY / MODEL / CNSPUBLISHED RESEARCH / INDEPENDENT REFERENCE
PLATE 01 / WHOLE-BRAIN RECONSTRUCTIONNATURE · 2024 · FIG. 1
Dorkenwald et al. · Neuronal wiring diagram of an adult brain

Nature 634, 124–138 (2024) · Fig. 1 · CC BY 4.0 · Monochrome display adaptation; original image preserved

Paper & figure legend
PLATE 02 / COMPUTATIONAL MODELNATURE · 2024 · FIG. 1
Published article

From connections to predictions.

A connectome-constrained model translates synaptic wiring into predicted activity. Sugar-sensing inputs and feeding-related outputs provide a concrete sensorimotor test case.

How to read this figure +

The circuit schematic defines the model; the response maps compare predicted activity under stimulation and silencing.

Evidence scope
Predicted neural responses, tested against selected feeding-related experiments.

Shiu et al. · A Drosophila computational brain model reveals sensorimotor processing

Fig. 1 · CC BY 4.0 · Monochrome display adaptation

Figure & legend ↗
PLATE 03 / BRAIN + VENTRAL NERVE CORDBIORXIV · 2025 · V2 · FIG. 1
Preprint v2 · 30 Oct 2025

The circuit extends into the body.

The male central nervous system reconstruction brings the brain and ventral nerve cord into one map, with neuron annotations and comparisons across existing connectomes.

How to read this figure +

Panels a–b locate the tissue and reconstruction. Later panels organize cell classes and compare matching neurons across datasets.

Evidence scope
An anatomical resource for studying sensory and motor pathways.

Berg et al. · Sexual dimorphism in the complete connectome of the Drosophila male central nervous system

Fig. 1 · CC BY 4.0 · Monochrome display adaptation · Figure from the 2025 preprint; final paper: Cell, 2026

Figure & legend ↗
RESEARCH / INTERPRETATION

This independently published neuroscience research provides background reading for the project. Its specimens, measurements and results are not operational data from this site, nor do they validate the strategies or digital immortality. Figures default to a monochrome reading treatment. Move across or touch a figure to reveal color around the pointer while preserving the dark reading treatment; source legends remain linked below.